The Fast Answer: GitHub Skyline Is for Model Output, GitHub City Is for Browser Exploration
GitHub Skyline is a contribution-history visualizer associated with the gh-skyline workflow. Instead of showing the familiar green calendar or an interactive browser city, it turns contribution activity into a skyline-like 3D model. The search intent is usually practical: people want to know whether Skyline still works, whether it can create an STL-style asset, and whether it is easier than opening a browser-based tool.
The important distinction is output. GitHub City vs GitCity vs GitHub Skyline comparisons show that Skyline is strongest when the final object matters. If you want a desk object, a conference demo, a printable model, or a repeatable local workflow, Skyline is worth considering. If you simply want to enter a username and see a 3D GitHub contribution graph quickly, GitHub City has less friction.
A good Skyline workflow starts with data hygiene. Open the official GitHub contribution graph and confirm that the activity you expect is actually counted. GitHub contribution visualizers do not fix missing commits, private-activity settings, branch rules, or fork behavior. They only transform the activity they can access into a more memorable visual format.
This page does not replace the gh-skyline repository instructions. It gives you the decision framework: validate the graph, choose a tool by output format, prepare the local environment only if you need exportable model files, and use a browser-first city tool when fast presentation matters more than 3D-printing control.
The official gh-skyline project describes GitHub Skyline as a GitHub CLI extension that generates a binary STL file from contribution data. The current installation path is gh extension install github/gh-skyline; use the repository instructions for the command flags and do not treat this page as a download mirror. Choose GitHub City vs GitCity vs GitHub Skyline when you are comparing output formats.
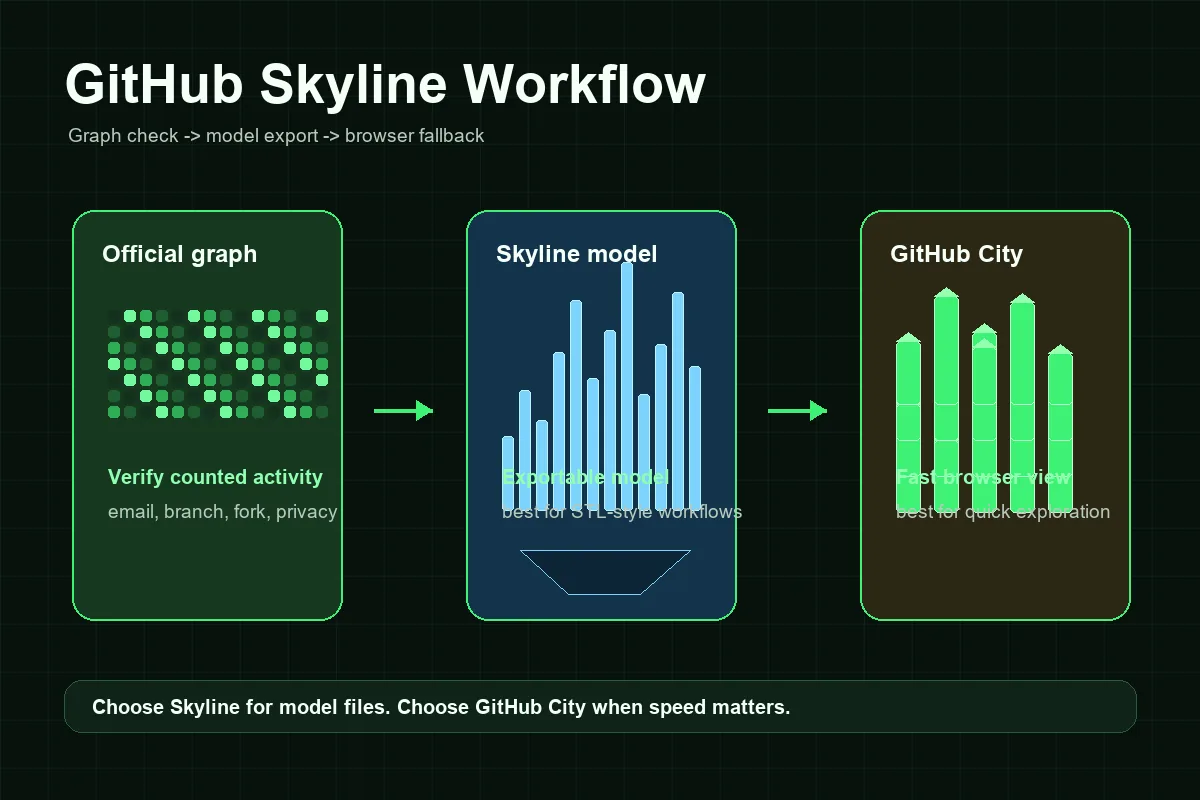
How a GitHub Skyline Workflow Usually Works
A Skyline workflow has more setup than a browser-only visualizer, but the steps are predictable once you separate data checks from model generation.
Confirm the profile and contribution graph
Start on the public GitHub profile. If the official contribution graph is sparse, private, or missing recent commits, fix that before blaming Skyline. The GitHub contribution graph guide explains the common counting rules.
Prepare the GitHub CLI workflow
Install the GitHub CLI first, authenticate with gh auth, then install the extension with gh extension install github/gh-skyline. Follow the official repository for current flags and prerequisites.
Generate the skyline model
Run the Skyline workflow for the target account and contribution year or range. Keep the username, time range, and authentication context consistent so the model reflects the profile you inspected.
Review the model before printing or sharing
Check whether active weeks create the expected height pattern. If the skyline looks empty, return to the official graph and the troubleshooting checks instead of repeatedly exporting the same incomplete data.
Use GitHub City for a fast visual fallback
When the goal is a portfolio screenshot, social share, or quick exploration, the browser-based GitHub City workflow is often faster than preparing export files.
GitHub Skyline vs GitHub City vs the Official Contribution Graph
Choose by output format. Skyline is model-first, GitHub City is browser-first, and the official graph is the source-of-truth checkpoint.
| Option | Best for | Output | Effort | Choose when |
|---|---|---|---|---|
| GitHub Skyline | Exportable or printable contribution history | Skyline-style 3D model | Medium | You need a model, STL-style workflow, or repeatable local generation. |
| GitHub City | Fast online 3D contribution visualization | Interactive 3D city in the browser | Low | You want to enter a username and explore the result quickly. |
| GitCity / CodeCity | Alternative city-style profile storytelling | Shareable or explorable visual scene | Low to medium | You want a different city metaphor or presentation style. |
| Official GitHub contribution graph | Checking whether activity was counted | Calendar heatmap | None | You need the baseline before using any 3D visualizer. |
Troubleshooting: Why a GitHub Skyline Can Look Empty or Wrong
Most Skyline problems start before the model is generated. If GitHub does not count an activity item in the official graph, a skyline export may not include it either. The usual causes are unmatched commit email, activity on a branch GitHub does not count, work left in an unmerged fork, private contribution visibility, repository eligibility, or a short delay before GitHub refreshes profile activity.
The second group of issues is local workflow friction. A command-line visualizer can fail because the CLI extension is not installed, authentication is missing, permissions do not match the target account, or the requested year has little visible activity. Treat those as setup problems rather than SEO or visualization problems.
Finally, remember that a skyline is a visual metaphor. Different tools may map weeks, days, or contribution counts into height differently. A skyline that looks shorter than a city does not always mean the data is wrong; it may simply use a different rendering scale.
Missing commits
Check commit email, counted branches, forks, repository visibility, and GitHub refresh timing before regenerating the skyline.
Private work
Private contributions can be anonymized or hidden depending on profile settings. Do not expect private repository names to appear in a public visual.
Wrong account or year
Confirm the username and time range. A skyline generated for a quiet year will look sparse even when the account is active now.
Tool setup failure
If the local command fails, verify GitHub CLI setup, authentication, extension installation, and repository instructions.
When GitHub Skyline Is Worth Using
Use GitHub Skyline when the final artifact is the point. It is a better fit for 3D printing, physical desk objects, event displays, team retrospectives, and personal developer keepsakes. In those cases, the extra local setup pays off because you can control the generated model instead of relying on a live browser scene.
Use GitHub City when speed and accessibility matter more. A recruiter, teammate, or visitor can open a page, enter a public username, and see a contribution city without installing anything. That makes GitHub City more practical for quick portfolio exploration, while Skyline remains better for model-oriented projects.
A strong portfolio can use both: Skyline for a polished export or printed object, GitHub City for interactive exploration, and the official GitHub contribution graph as the factual baseline. Link them with clear language so viewers understand that all three are different views of contribution history rather than three competing measurements.
Practical rule
If you cannot explain why you need a model file, start with GitHub City. If you need a physical or exportable skyline, use GitHub Skyline after verifying the official contribution graph.
FAQ
What is GitHub Skyline?
GitHub Skyline is a model-oriented way to turn GitHub contribution history into a skyline-style 3D visualization, often discussed with the gh-skyline workflow.
Is GitHub Skyline the same as GitHub City?
No. GitHub Skyline is better for exportable skyline models, while GitHub City is better for quick browser-based 3D city exploration.
Can GitHub Skyline make an STL file?
Skyline searches often focus on STL-style or printable output. Follow the current gh-skyline repository instructions for exact export behavior because project tooling can change.
Why is my GitHub Skyline empty?
First check the official GitHub contribution graph. Missing commit email, branch rules, forks, private visibility, repository eligibility, or the wrong year can make a skyline look empty.
Which is better for a portfolio, GitHub Skyline or GitHub City?
Use GitHub City for a fast interactive visual on the web. Use GitHub Skyline when you want a model, print, or exportable artifact as part of the portfolio story.
Does GitHub Skyline generate an STL file?
Yes. The official github/gh-skyline project describes the extension as generating a binary STL file from GitHub contribution data. Check the repository before installing because command-line requirements can change.