The Fast Answer: GitHub City Follows the Contribution Graph Baseline
A GitHub contribution graph is the calendar-style activity chart on a GitHub profile. It can include counted commits, pull requests, issues, reviews, and other qualifying activity. It is not a raw list of every Git action you performed, and it is not guaranteed to update the instant you push code.
This matters for GitHub City because a 3D contribution city can only be as complete as the activity data it can use. If your official GitHub graph is missing commits, the generated city may also look empty, short, or inconsistent with how much work you remember doing.
The practical workflow is simple: check the official graph first, confirm the activity meets GitHub's rules, wait for updates when needed, then use GitHub City or another 3D GitHub contribution graph tool for presentation and exploration.
If you searched for a GitHub contribution graph image or a GitHub contribution graph generator, separate the data question from the output question. This guide explains the official graph first; then you can use the GitHub City tool or the 3D tool comparison to present the same contribution pattern.
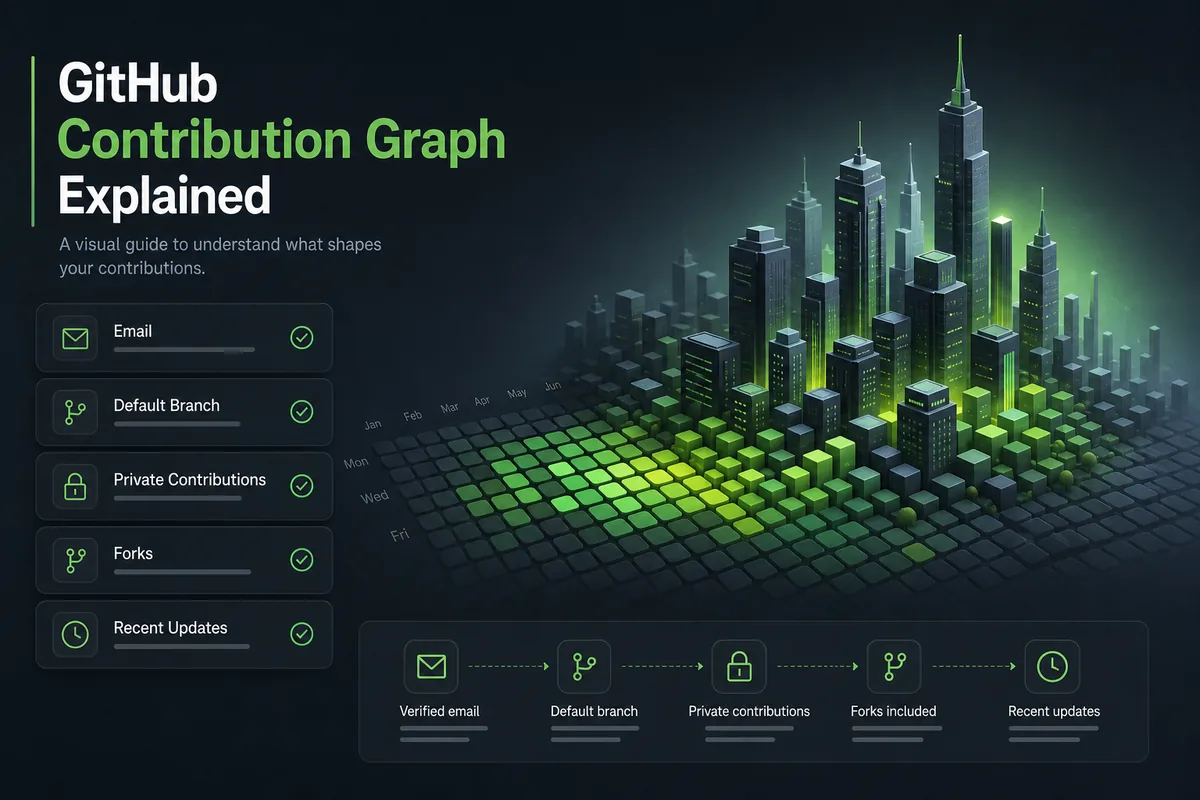
What Counts on a GitHub Contribution Graph?
GitHub's official rules are specific. The table below summarizes the checks that matter most before you troubleshoot a 3D visualization.
| Activity | When it can count | What to check |
|---|---|---|
| Commits | A commit can count when it is associated with your account, uses a verified email, and lands on a counted branch in an eligible repository. | Commit email, default or gh-pages branch, repository visibility, and whether the commit belongs to a fork. |
| Pull requests | Pull requests can count when they are opened in eligible repositories and associated with your GitHub account. | The account that opened the PR, repository state, and whether the PR is visible. |
| Issues and discussions | Issue and discussion activity may count when it happens in eligible repositories and is tied to your account. | Repository visibility and whether the activity appears on the profile activity timeline. |
| Code reviews | Reviews can count when they are attached to pull requests in eligible repositories. | The reviewed PR, repository eligibility, and whether you used the expected account. |
| Private contributions | Private activity can show as anonymized contribution squares when private contribution visibility is enabled. | Profile contribution settings and whether you expect private details or only anonymized counts. |
Why Are GitHub Commits Not Showing?
When a contribution graph looks wrong, work through the causes in this order. These checks solve the most common gaps before you blame a third-party visualizer.
Check the commit email
GitHub must be able to associate the commit email with your account. If you committed from a local Git config that used a work email, typo, or unverified address, the commit may not appear on your graph.
Check the branch and repository
Commits generally need to land on counted branches in eligible repositories. Work that stays on an unmerged branch, a fork, or a repository state GitHub does not count can be missing from the profile graph.
Check private contribution settings
Private work is not shown with full repository details. If you want private activity to affect the visible green graph, review GitHub's private contribution setting on your profile.
Wait for the graph to update
Recent activity can take time to appear. If you just pushed code, compare again later before treating the result as a permanent data problem.
Compare with the official profile graph
If the official profile graph does not show the work, GitHub City, GitHub Skyline, and other 3D visualizers may not show it either.
Do Private Repository Contributions Affect the Green Graph?
Private repository activity can affect the visible contribution graph only within GitHub's privacy rules. When private contribution visibility is enabled, viewers may see that activity happened, but not the private repository name or sensitive details.
This distinction is important for portfolios. A dense green graph can show consistency, but it does not prove exactly what private work was done. For the same reason, a GitHub 3D contribution graph can communicate rhythm and activity density, but it should not be treated as a complete audit log.
Portfolio rule
Use private contribution visibility when you want activity to count visually, but explain important private work separately in your resume, portfolio, or project notes.
How This Affects GitHub City and 3D Contribution Graph Tools
GitHub City turns contribution patterns into a city-like scene. That makes activity easier to present, but it also magnifies data gaps. One missing active week can become a visibly lower district. A private-work setting can change whether a city looks balanced or surprisingly empty.
Before sharing a 3D city, use the official profile graph as the baseline. If the green graph is accurate, the 3D view becomes a strong visual layer for storytelling. If the green graph is wrong, fix the source data first.
Best time to use GitHub City
Use it after your official contribution graph looks correct and you want a more memorable portfolio or profile visual. For a context-based yearly benchmark, read the <a href="/github-contributions-per-year/" class="githubcity-secondary-link">GitHub contributions per year guide</a>.
Best time to troubleshoot
Troubleshoot when the city is empty, recent work is missing, or private contributions do not appear the way you expected.
Best source for rules
Use GitHub's official contribution documentation for counting rules, then use this guide as a practical checklist.
Best internal next step
Open the GitHub City homepage to generate the 3D city once the contribution graph baseline is correct.
Best time to export a PNG
Use the <a href="/github-contribution-png/" class="githubcity-secondary-link">GitHub contribution PNG guide</a> when you need a fixed contribution image for a portfolio, slide, or article after the source graph is correct.
FAQ
What is a GitHub contribution graph?
It is the calendar-style activity chart on a GitHub profile. It summarizes qualifying contribution activity over time, but it is not a complete raw log of every commit or repository action.
Why are my commits not appearing on GitHub?
The most common causes are unmatched commit email, activity on a non-counted branch, fork behavior, private contribution visibility, repository eligibility, or a delay before GitHub refreshes the graph.
Do GitHub Classroom commits show on the contribution graph?
They can show when they meet GitHub's normal contribution rules. If classroom work happens in forks, private repositories, or branches that do not qualify, it may not appear as expected.
Is GitHub City a replacement for the official contribution graph?
No. GitHub City is a visual layer for exploring and presenting contribution patterns. The official GitHub contribution graph is still the better source for checking whether activity was counted.
Can a 3D GitHub contribution graph show private repo names?
It should not expose private repository details. Private activity may be represented only as anonymized contribution count when your GitHub settings allow it.
Does the GitHub contribution graph update only after a pull request?
No. A pull request is one possible contribution path, but qualifying commits and other activities can also appear when GitHub's repository, branch, email, account, and timing rules are satisfied. A qualifying commit may take up to 24 hours to appear.