Fast Answer: GitHub Streak Stats Are a README Widget, Not a Productivity Score
GitHub streak stats usually refers to a profile README card that calculates consecutive contribution days or streak-style activity from public GitHub contribution data. It is useful as a quick visual signal, but it should not be treated as a complete record of your work. Reviews, planning, private work, pair programming, and work outside GitHub can be invisible or only partly represented.
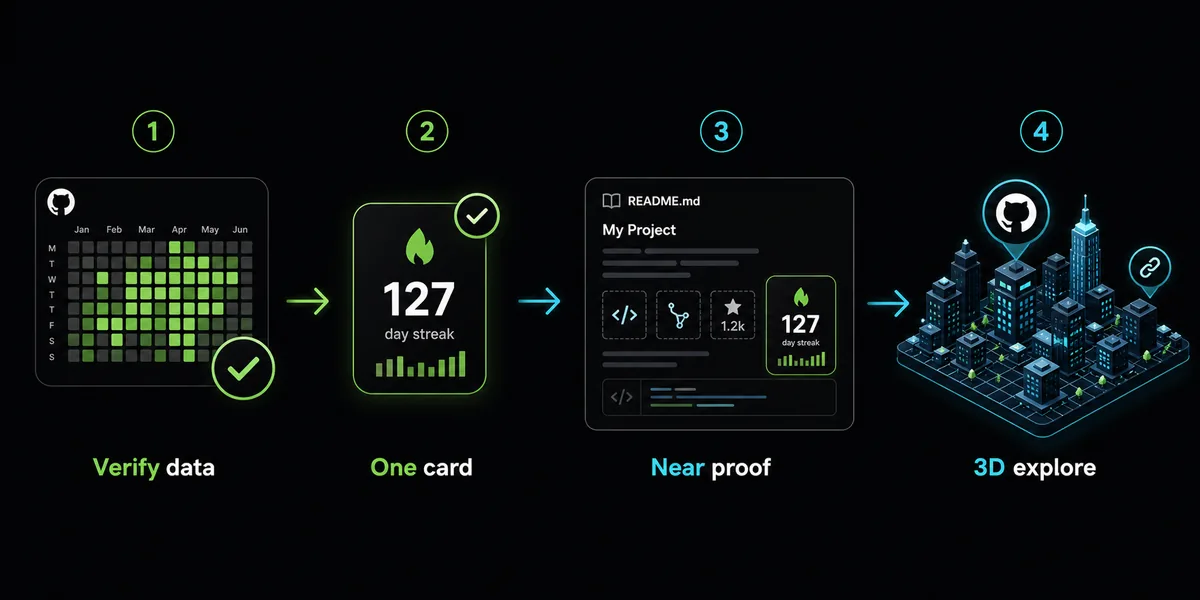
The best use is narrow: add a streak card when you want a lightweight activity widget inside a GitHub profile README. If you need a full profile structure first, use the GitHub profile README template guide. If you want an automatically generated 3D contribution image, read the profile-3d-contrib guide. If you want visitors to explore a live 3D contribution city, send them to GitHub City.
Before changing any streak widget, compare the result with the official GitHub contribution graph. If GitHub does not count a commit because of email, branch, fork, repository, private-visibility, or timing rules, a README streak service usually cannot recover it. Fix the source activity problem first, then adjust the card URL, theme, and README placement.

How to Add GitHub Streak Stats Without Making the README Noisy
A good streak setup is small and deliberate. Put the card near the activity or proof section, keep the surrounding explanation short, and avoid stacking too many remote widgets above your projects.
The card should answer one question: is this profile visibly active? It should not become the hero of the README unless the rest of the profile already explains who you are, what you build, and which projects deserve attention.
Decide what the card proves
Use a streak card to show visible contribution rhythm. Do not use it as the only evidence of skill, seniority, or reliability.
Copy the official card URL
Start from the maintained streak stats service or repository instructions, set the username, and choose a theme that remains readable in GitHub light and dark modes.
Embed it in README.md
Use normal Markdown image syntax or an HTML image tag with useful alt text. Keep the card below your headline and above or near project proof.
Check the official contribution graph
If the streak looks broken, inspect GitHub contribution rules before editing the card. The contribution graph guide covers the common missing-data causes.
Add context instead of more widgets
One streak card plus a stats card or GitHub City link is usually enough. Too many cards slow the README and distract from projects.
GitHub Streak Stats vs GitHub Readme Stats vs GitHub City
These tools sit at different layers of the profile story. Streak stats focus on consistency, GitHub Readme Stats summarizes repository or language signals, and GitHub City turns contribution history into an interactive 3D scene.
Choose by job, not by decoration. If a visual does not help a visitor understand your work faster, it should move lower in the README or disappear.
| Option | Best for | Setup | Risk | Best fit |
|---|---|---|---|---|
| GitHub streak stats | Showing visible contribution rhythm in a profile README. | Add a remote card URL or image reference. | Can look like a productivity score if left unexplained. | Use as a compact activity signal near profile proof. |
| GitHub Readme Stats | Showing language, repo, or general profile summary cards. | Configure card parameters and themes. | Too many cards can slow and clutter the README. | Use when a card supports the projects below it. |
| GitHub City | Letting visitors explore contribution history as a 3D city. | Open the browser tool and enter a username. | Not a README card unless you link to it clearly. | Use when you want a memorable interactive visual. |
| profile-3d-contrib | Generating README-ready 3D contribution images with Actions. | Set up workflow permissions and output paths. | Workflow or commit-step failures can break the image. | Use when the README needs generated 3D image files. |
Troubleshooting Broken, Empty, or Misleading Streak Cards
Most streak problems are data problems, not design problems. If the official contribution graph is missing activity, the card will usually miss it too. Start with commit email, default branch, fork behavior, repository visibility, private contribution settings, and update delays.
The next layer is card configuration. Check the username, URL encoding, theme name, cache behavior, and whether GitHub can fetch the remote image. If the README is slow or visually heavy, remove extra widgets before adding another one.
The streak reset unexpectedly
Check whether the missing day appears on the official contribution graph. If not, inspect email attribution, counted branches, forks, private settings, and time zones.
The card is blank
Confirm the image service is reachable, the username is correct, and GitHub is allowed to load the remote image.
The README feels cluttered
Keep one activity card, one project proof section, and one optional visual link. Move decorative cards below stronger evidence.
The metric feels unfair
Add a sentence explaining that the streak reflects visible GitHub activity, not all engineering work or code quality.
Where a Streak Card Belongs in a Strong GitHub Profile
A streak card works best after the opening summary and before or after project highlights. That placement gives visitors a quick activity signal without burying the portfolio evidence they came to inspect.
For portfolio storytelling, combine three layers: written context, real project proof, and one visual layer. The visual layer can be a streak card, a GitHub Readme Stats card, a profile-3d-contrib image, or a GitHub City link. Do not make all of them compete for attention at the top of the README.
If your profile already uses GitHub City, frame it as exploration: a visitor can open the 3D city to inspect the contribution pattern behind the card. That creates a clearer path than stacking another badge or unrelated widget.
Practical rule
If the streak card does not make the next project easier to trust, move it lower or remove it. Activity visuals should support the profile, not become the profile.
FAQ
What is GitHub streak stats?
It is a README-style visual that shows consecutive or streak-like GitHub contribution activity based on public contribution data.
How do I add streak stats to my GitHub profile?
Add a maintained streak card URL to README.md in the special profile repository whose name matches your GitHub username, then verify the image loads in both light and dark modes.
Why did my GitHub streak reset?
Usually because GitHub did not count visible activity for one or more days, or because the streak service cache/configuration does not match your profile data.
Is GitHub streak stats the same as GitHub Readme Stats?
No. Streak stats focus on consecutive activity. GitHub Readme Stats cards usually summarize profile, repository, or language signals.
Should I use a streak card with GitHub City?
Yes, when each has a job. Use the card as a quick README signal and GitHub City as an interactive way to explore the contribution pattern.