What Is GitHub Commit Art?
GitHub commit art is any deliberate visual made from commit or contribution data. The narrow definition is pixel art drawn on the contribution calendar. The broader and more useful definition also includes contribution-graph images, custom-color SVGs, animated README graphics, year-over-year mosaics, 3D skylines, and city-style views based on authentic activity.
The contribution calendar looks like a 53-by-7 canvas, but it is not a normal drawing board. Each square represents a date, and its color intensity reflects counted activity relative to the rest of the year. GitHub decides what appears by applying contribution rules. Account email, repository type, default branches, private-activity settings, and processing time can all change the result.
That creates an important choice. You can manipulate historical dates or generate empty commits to force a pattern, or you can transform genuine contributions into art without rewriting the story. The second route is usually better for a public portfolio: it preserves meaning, is easier to explain, and avoids turning decorative squares into a false claim about output.
If your goal is simply to save the existing grid, use the GitHub contribution PNG guide. If you want to understand missing squares first, read the GitHub contribution graph rules.
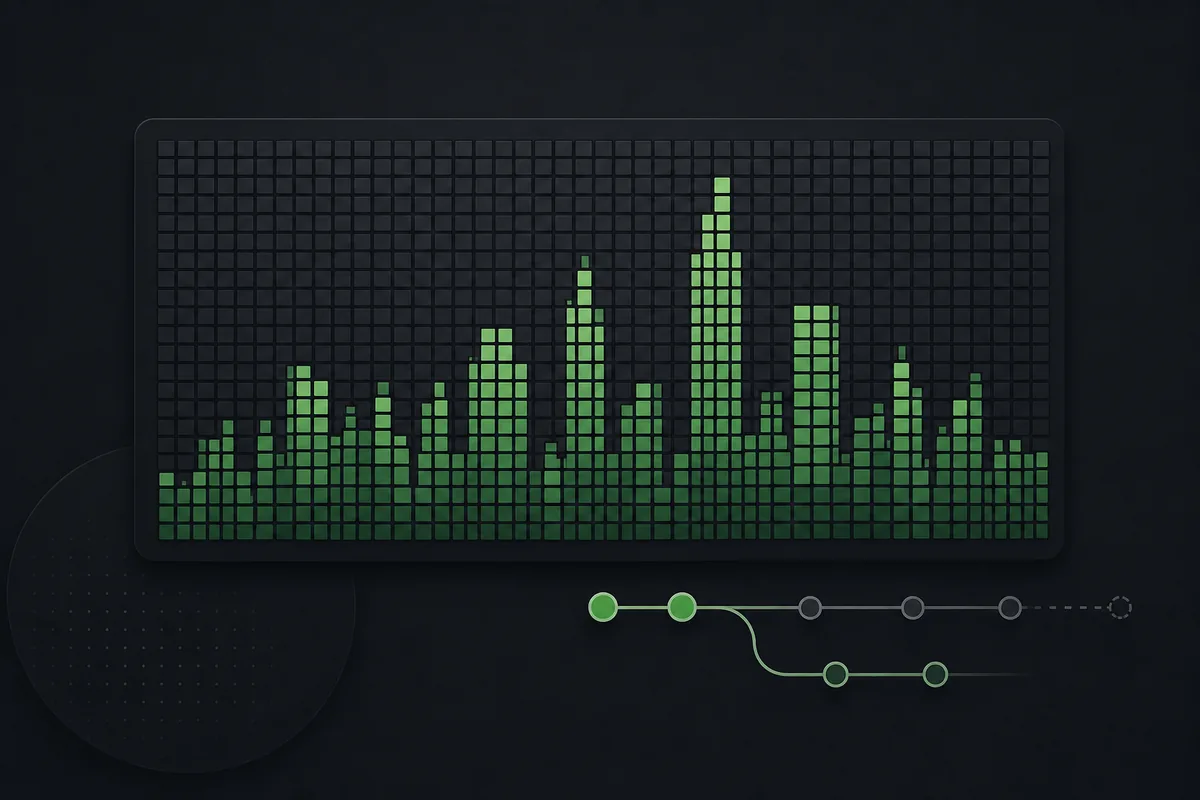
7 Ways to Create GitHub Contribution Graph Art
The right method depends on whether you want to decorate the live GitHub profile, create a portable portfolio asset, or explore the data in a new form. The methods below move from the least invasive to the most risky. A live calendar pattern is not automatically better than a clear exported visual.
For most developers, an exported image, README graphic, or 3D visualization gives more design control than forcing the public calendar to spell a word. These formats can include a caption, date range, and explanation, so a reviewer knows what the visual represents.
| Method | What it creates | Best fit |
|---|---|---|
| 1. Theme an exported graph | A PNG or SVG using your real contribution dates and a controlled color palette. | Portfolio pages, presentations, profile READMEs, and social images. |
| 2. Build a README mosaic | A static grid, heatmap, or year mosaic placed in the profile README. | Developers who want layout control without changing Git history. |
| 3. Animate the grid | A contribution snake, reveal, pulse, or time-lapse based on existing activity. | A playful README element when the animation remains accessible and lightweight. |
| 4. Create a 3D skyline | Blocks or towers whose height represents contribution intensity. | Printable models, annual retrospectives, and portfolio visuals. |
| 5. Explore a 3D city | An interactive city-like scene created from a public GitHub username. | Fast browser exploration and a memorable way to discuss activity patterns. |
| 6. Plan future project rhythm | A sketch that guides a real coding challenge, learning plan, or documentation sprint. | Motivation when every square still represents useful work. |
| 7. Use a labeled art repository | A deliberately generated pixel pattern kept separate from ordinary project history. | Experiments only, with a clear README explaining that the repository is artwork. |
When GitHub Pixel Art Becomes Misleading
Contribution art is not inherently dishonest. The problem begins when a decorative pattern is used to imply a history of productive work that did not happen. Recruiters and collaborators cannot infer code quality, project difficulty, teamwork, or learning from square density alone. A beautiful calendar may be art, but it is weak evidence of engineering impact.
Backdating is also technically fragile. Git has author and committer dates, while GitHub applies its own contribution-credit rules and may rebuild graphs after history changes. A script that produces local commits does not guarantee the intended public pattern. Rewriting shared history, force-pushing, or mixing generated commits into a real repository can make collaboration and auditing harder.
A transparent rule is simple: keep normal project history useful, put experiments in a separate repository, label generated patterns, and never describe decorative commits as client work, open-source impact, or a long coding streak. For a deeper discussion, see the contribution graph gaming guide.
Avoid meaningless commit spam
Hundreds of empty commits add noise, consume repository history, and do not demonstrate useful work.
Do not rewrite shared history
A force push can break collaborators' branches and invalidate links, reviews, or signed-history expectations.
Explain the artifact
State the data range, source, transformation, and whether the pattern was generated or based on normal work.
Show projects beside the visual
Pair art with repositories, demos, decisions, and outcomes so the portfolio communicates real ability.
A Practical Workflow for Honest GitHub Commit Art
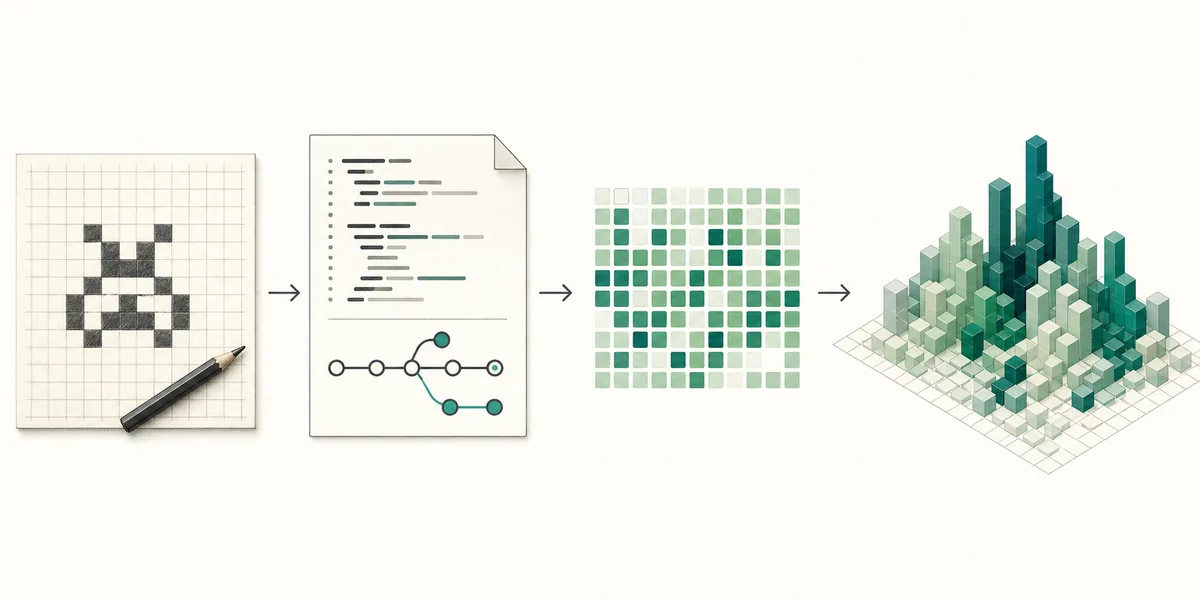
A strong workflow separates creation from evidence. First decide what story the visual should tell. Then select a format that can tell that story without corrupting useful history. Finally, verify the result against GitHub's official graph and add enough context for another person to interpret it correctly.
This approach works for a tiny pixel motif, an annual contribution poster, or a full 3D city. It also gives you a clean exit: README assets and exported images can be replaced without rewriting commits.
Choose the message and format
Decide whether you need a live profile pattern, a README visual, an export, an animation, or a 3D view. Prefer the least invasive format that meets the goal.
Keep useful work in normal repositories
Commit code, documentation, tests, issues, and reviews where they belong. Do not distort a production repository merely to color a square.
Verify what GitHub counted
Compare the result with the official profile graph. Check email, branch, repository, visibility, and processing rules if expected activity is missing.
Transform and caption the data
Export, animate, recolor, or render the verified activity. Add a short caption stating the date range and transformation so the visual is self-explanatory.
Pair the art with evidence
Link to the projects, README, case study, or learning notes behind the pattern. Let the artwork attract attention while the surrounding work earns trust.
Where GitHub City Fits the Commit Art Idea
GitHub City is the fastest option when you want to turn an existing public contribution pattern into an interactive 3D scene. It does not require you to plan a word on the calendar or rewrite historical commits. Enter a public username, inspect the skyline, and use the result as an exploratory visual rather than a productivity score.
A city view is especially useful when the natural rhythm is the interesting part: busy release periods become taller districts, quiet weeks create space, and a full year becomes easier to discuss. If you need a printable model instead, compare the GitHub Skyline workflow. If you need a flat asset, choose PNG or SVG output.
Best default
Use real contributions as the source, choose a reversible visual format, and explain what the artwork shows. That keeps the design memorable without turning the graph into a false résumé claim.
GitHub Commit Art FAQ
What is the difference between commit art and contribution graph art?
Commit art often means patterns created through dated commits. Contribution graph art is broader and can include exports, SVGs, animations, 3D models, and visualizations based on commits, pull requests, issues, reviews, or other counted activity.
Can I make GitHub pixel art without fake commits?
Yes. Recolor or export your existing grid, create a README-only graphic, animate authentic data, or render it as a skyline or city. These methods do not require changing historical dates.
Can you backdate commits and fill the GitHub chart?
Git supports author and committer dates, but GitHub still applies contribution rules. Backdating solely to manufacture activity can mislead viewers, and rewriting shared history can damage a repository. Use a labeled isolated experiment if you study the mechanics.
Why does my pattern not appear on GitHub?
Check whether the commit email belongs to your account, whether the repository is eligible, whether work reached a counted branch, whether private activity is visible, and whether GitHub has finished processing the graph.
Is GitHub commit art useful for recruiters?
It can start a conversation and show design curiosity, but it is not proof of engineering quality. Pair it with clear project links, decisions, demos, and results.
Which format is easiest to maintain?
A static WebP, PNG, or SVG in a README or portfolio is usually simplest. It is easy to replace, caption, optimize, and remove without touching repository history.