Fast Answer: A GitHub Commit Graph Is Not a Raw Git Log
A GitHub commit graph is usually what people mean when they look at the commit-driven part of the GitHub contribution graph. It is not a complete audit log of every local commit you have ever made. GitHub only turns a commit into visible profile activity when the commit, repository, branch, account email, and timing rules line up.
That distinction matters when you open GitHub City. A 3D city can make contribution data easier to explore, but it cannot prove that every local commit existed. If the official GitHub profile graph does not count the commit, a city, skyline, or activity visualizer may look smaller than expected.
The best workflow is to check the official GitHub profile first, inspect the commit author email and branch, wait for normal graph updates, and only then compare the result with a 3D tool. This keeps troubleshooting focused on data quality instead of blaming the visualization layer.
The phrase GitHub commit history graph usually points to the commit-focused part of the broader contribution graph. Use the official profile graph to confirm that a commit was counted, then use a GitHub contribution graph guide for wider activity rules or a 3D visualizer for presentation. A visual city cannot restore a commit that GitHub did not attribute.
What Makes a Commit Count on the Graph?
GitHub documents several requirements for commits to appear in a profile contribution graph. The rules are stricter than “I pushed code to GitHub.” A commit can be visible in a repository and still fail to appear as profile contribution activity.
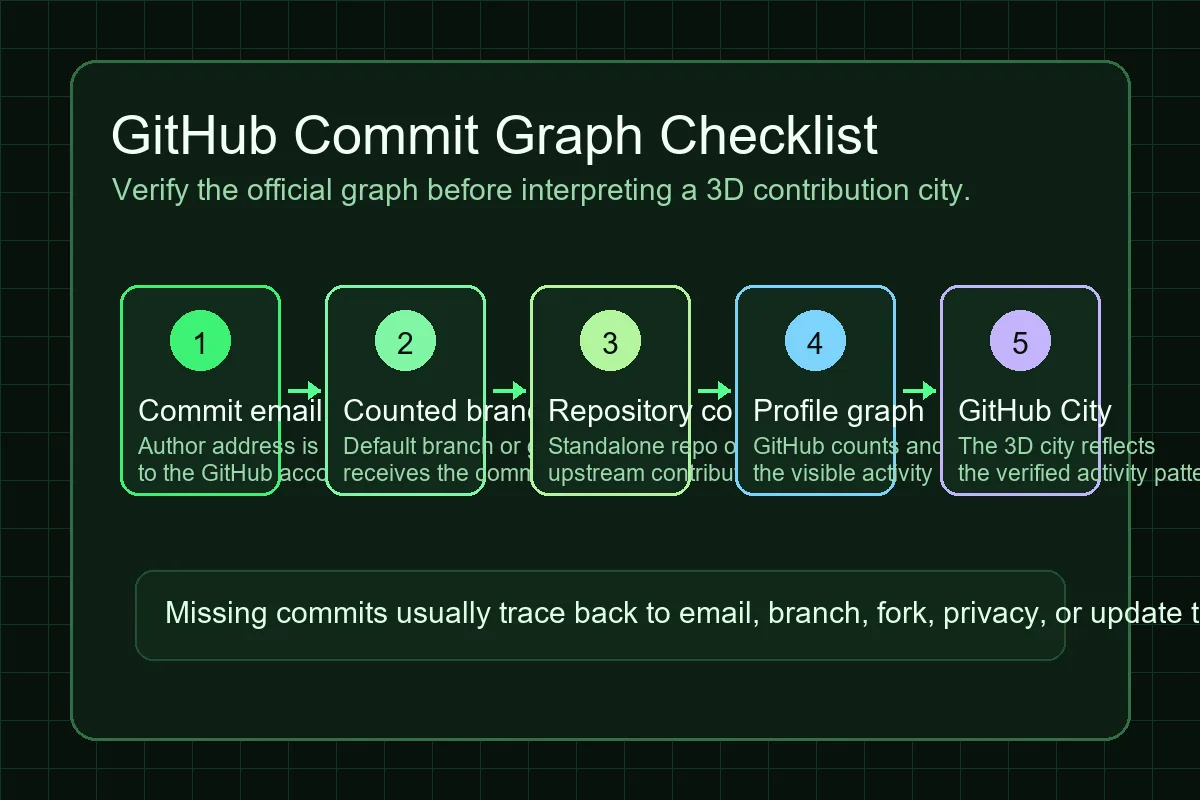
The table below turns the official rules into a practical checklist you can use before opening a 3D contribution graph tool.
| Check | Healthy signal | Common problem |
|---|---|---|
| Commit email | The author email is connected to the GitHub account or uses the account noreply address. | The local Git config used an old, work, typo, or generic local email. |
| Branch | The commit reached the repository default branch or gh-pages branch. | The work stayed on a feature branch, dev branch, or unmerged branch. |
| Repository context | The commit was made in a standalone repository and meets GitHub account relationship rules. | The commit only exists in an unmerged fork or a repository context GitHub does not count. |
| Timing | The graph has had time to update and the commit timestamp is sane. | The commit is very recent, amended, rebased, or has confusing author-date history. |
| Private activity | Private contribution visibility is enabled when you expect private work to affect the graph. | Private work is hidden or only appears as anonymized activity. |
Troubleshooting: Why Are GitHub Commits Not Showing?
Work through these checks in order. They cover the highest-frequency causes found in official docs, community discussions, and developer support threads.
Inspect the commit author email
Open the commit on GitHub and check the author identity. For a deeper check, append .patch to a commit URL and inspect the From: line. If the address is not connected to your GitHub account, add and verify it where possible.
Confirm the branch that GitHub counts
Commits usually need to land on the default branch or gh-pages. If your work is only on dev, feature/*, or another branch, open a pull request or merge into the counted branch instead of expecting the graph to change immediately.
Check forks and repository relationship
Commits made only in a fork often do not count until they are merged upstream through a pull request. Also confirm that you have the required relationship to the repository, such as collaborator, organization member, fork owner, issue opener, or pull request opener.
Review private contribution settings
Private repositories can influence the graph only according to GitHub profile visibility settings. Viewers without access to the private repository will not see repository details, and a 3D visualizer may only receive limited public context.
Wait before rewriting history
GitHub may need time to update a graph. If the commit is recent and every rule looks correct, wait before changing branches, rewriting author metadata, or force-pushing. Rewrites can fix attribution problems, but they can also disrupt collaborators.
How to Read a Commit Graph Before You Build a GitHub City
A healthy commit graph is best read as a pattern, not a productivity score. Dense weeks can mean focused coding, but they can also reflect small commits, rebases, generated changes, or repository habits. Sparse weeks can mean research, design, reviews, private work, pair programming, or activity in systems that GitHub cannot show.
For portfolio use, explain the story behind the pattern. A consistent year of public work, a short launch sprint, or a long open-source maintenance period can all look different. GitHub City is useful because it turns that pattern into a city view, but the city should support the story rather than replace the context.
If you need a broader explanation of issues, pull requests, reviews, discussions, and private activity, read the GitHub contribution graph guide. If you are choosing between visualizers, the 3D GitHub tool comparison explains when a city, skyline, or heatmap is the right output.
For developers
Use the commit graph to spot periods of visible coding activity, then annotate the result with project context.
For reviewers
Treat the graph as a discovery aid, not a hiring metric. It misses private work, non-code work, and uncounted repositories.
For students
If your learning commits are not green, check branch and email setup before trying to rebuild your profile history.
For GitHub City users
Verify the official graph first so the generated 3D city reflects the data you expect.
Where 3D Tools Fit Into Commit Graph Analysis
3D visualizers such as GitHub City are presentation tools. They help you explore the shape of contribution history, share a memorable developer profile, and compare activity periods visually. They are not a replacement for GitHub Docs, repository commit logs, or a team analytics system.
This is also why the keyword boundary matters. The homepage should keep targeting people who want the live GitHub City tool. This page targets the more diagnostic intent behind “github commit graph”: users want to know what counts, why commits disappear, and how to trust the data before using a visualization.
Next step
Once the official graph looks correct, open GitHub City and generate a 3D city from the username you checked.
FAQ
Is the GitHub commit graph the same as the contribution graph?
Not exactly. The contribution graph can include commits, pull requests, issues, reviews, discussions, repository creation, forks, and other qualifying activity. A commit graph is the commit-focused part of that broader profile activity picture.
Why do commits show in a repository but not on my profile graph?
The commit may use an email not linked to your account, live only on an uncounted branch, belong to an unmerged fork, be too recent, or sit in a repository context that does not meet GitHub contribution criteria.
Do private commits show on the commit graph?
Private activity can affect the graph when private contribution visibility is enabled, but viewers usually see anonymized counts rather than repository details.
Will GitHub City show commits that GitHub does not count?
Usually no. GitHub City and similar visualizers depend on contribution data that GitHub exposes or makes visible. Fix the official graph first, then regenerate the city.
Should I rewrite Git history to fix a missing graph?
Only after confirming the cause and understanding the collaboration risk. Adding a verified email can rebuild attribution automatically in some cases, while rewriting shared history can affect other contributors.
Why is my GitHub commit not reflecting in the graph?
Check the commit email, repository type, branch, account relationship, fork status, and update delay. GitHub may not count a commit until those conditions are satisfied, and a qualifying commit can take up to 24 hours to appear.