Fast Answer: Contribution Graph Gaming Is Useful Only When the Data Is Honest
GitHub contribution graph gaming is the habit of treating the green contribution calendar like a game board: chasing streaks, filling empty days, turning activity into a visual challenge, or converting the pattern into something more playful such as a 3D city. That can be motivating when it encourages steady real work. It becomes harmful when the visual pattern matters more than the code, review, issue, documentation, or learning behind it.
A healthy contribution graph is not a leaderboard and it is not a complete work history. GitHub counts specific activity under specific rules, so the graph can miss legitimate private work and can also include low-value activity. Before you show the graph in a README, resume, or portfolio, treat it as one context signal rather than proof of impact.
For a visual tool like GitHub City, the same rule applies. A 3D city makes contribution rhythm easier to understand, but it should amplify real work instead of hiding weak context. Use the official graph as the baseline, explain what the pattern represents, and link to projects or notes that show actual outcomes.

What Searchers Usually Mean by Contribution Graph Gaming
The phrase can describe several different needs. Some developers want a fun way to stay consistent. Others are worried that streak culture rewards appearances. A smaller group is looking for visual toys that transform the grid into a game-like scene.
Those intents overlap, but they need different answers. A single page about contribution graph rules is not enough, because this topic is about behavior, presentation, and portfolio trust.
The exact phrase contribution graph gaming usually describes treating the green grid like a score. That can be healthy when it encourages consistent, meaningful work, but it becomes misleading when activity is created only to fill squares. Judge the habit by the value of the work, not the number of colored cells.
| Searcher | Need | Best fit |
|---|---|---|
| Streak builder | Wants motivation without burning out. | Use goals around real tasks, not empty commits. |
| Portfolio reviewer | Wants to know whether a green graph proves skill. | Treat it as a consistency signal and check project evidence. |
| Visualizer user | Wants a more playful graph display. | Use counting rules first, then a 3D visual. |
| Ethics checker | Worries about fake activity or inflated signals. | Prefer clear context and avoid claims the graph cannot support. |
Where Contribution Graph Gaming Goes Wrong
The problem is not motivation. The problem is optimizing for a surface that hiring managers, collaborators, and readers may misunderstand. A perfect streak can hide tiny commits. A quiet week can hide offline design work, private repositories, reviews in another account, or focused deep work that GitHub does not count.
This is why a contribution graph should be paired with project links, written context, and honest notes about what the activity represents.
Empty commits
Committing meaningless changes to keep a streak alive makes the graph look active while adding no value.
Private work ambiguity
Private contributions may appear only as anonymized activity, so the graph cannot explain the work by itself.
Streak pressure
Daily streaks can reward small visible actions over larger useful work that happens less frequently.
Visual overclaiming
A 3D city, trophy, or streak card can look impressive, but it still needs real project evidence nearby.
A Better Workflow: Work, Verify, Explain, Visualize
A contribution graph can still be a strong portfolio asset when the workflow is disciplined. Start with real work that matters. Verify that GitHub counted the activity correctly. Add context so readers understand what the pattern means. Then use visuals such as GitHub City to make the story easier to scan.
This order prevents the visual layer from becoming the whole message. It also helps you avoid troubleshooting a 3D view when the real issue is a missing email, an unmerged branch, or private visibility settings.
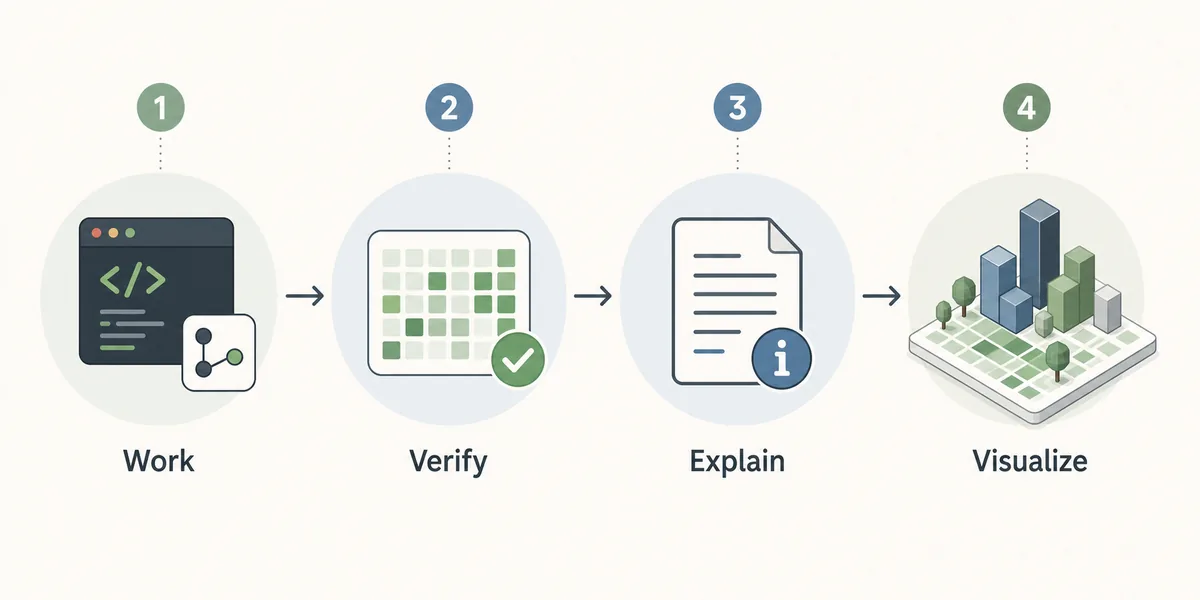
Do real contribution work
Prioritize shipped features, reviews, docs, tests, issue triage, learning projects, and maintained repositories.
Verify the counted graph
Compare activity with GitHub's official contribution rules before you assume a visualizer is wrong.
Explain the context
Point readers to projects, releases, README notes, or case studies that show why the activity mattered.
Visualize after verification
Use GitHub City, Skyline, PNG exports, or README widgets as presentation layers, not substitutes for evidence.
How GitHub City Fits the Gaming Intent
GitHub City is most useful when you want the playful side of contribution graph gaming without pretending the graph is more precise than it is. It turns activity density into a city-like layout, which can make consistency and quiet periods easier to discuss.
Use it in a portfolio section, profile README, or team retrospective with a short explanation: what period the city reflects, whether private activity is included, and which projects readers should inspect next. If you need a static image instead, the GitHub contribution PNG guide explains when a still image is better than an interactive city.
Practical rule
Let the visualization invite curiosity, then let real repositories, docs, releases, and issue discussions provide the proof.
FAQ
Is GitHub contribution graph gaming bad?
No. It is useful when it motivates real work or makes activity easier to understand. It becomes bad when it encourages fake commits, misleading claims, or burnout.
Can I make my GitHub graph look better without cheating?
Yes. Work consistently on real repositories, use the correct commit email, merge useful work into counted branches, document projects, and explain private or offline work separately.
Does GitHub City prove that someone is a strong developer?
No. GitHub City is a visual summary of contribution patterns. It should be read alongside code quality, project outcomes, reviews, documentation, and collaboration evidence.
Should I chase a daily contribution streak?
Only if it supports your actual goals. A steady routine can help learning, but a streak should not replace thoughtful work, rest, or larger tasks that do not produce daily commits.
What should I link next to a 3D contribution graph?
Link the projects, releases, pull requests, notes, or README sections that explain what the activity produced. The graph should support that story, not replace it.
Is contribution graph gaming the same as cheating on GitHub?
Not automatically. Using the graph as motivation is harmless when the commits represent real work. It becomes deceptive when empty, automated, or irrelevant activity is presented as evidence of skill or productivity.