What GitHub README Stats does
GitHub README Stats is an open-source service that generates SVG cards from a GitHub username. The main card can show stars, commits, pull requests, issues, contributed repositories, rank, and other activity signals. A separate top-languages card summarizes language usage across repositories.
The cards are useful because they are easy to embed in a profile README, but they are not a complete measure of engineering ability. Repository visibility, private activity settings, forks, generated files, and the service cache can affect what appears. Treat the card as a compact orientation aid, not a performance score.
For a balanced profile, place the card after a short introduction or featured-project section. Link readers to the official repository for current parameters, then use a focused page such as the GitHub Streak Stats guide, GitHub Profile Trophy guide, or GitHub City tool when they need a different view of contribution activity.
A card can start a conversation, but project descriptions should finish it. Explain the problem each project solves, your role, the tradeoffs you made, and where a reviewer can inspect the code. Those details make the statistics interpretable instead of decorative.

How to add and configure a stats card
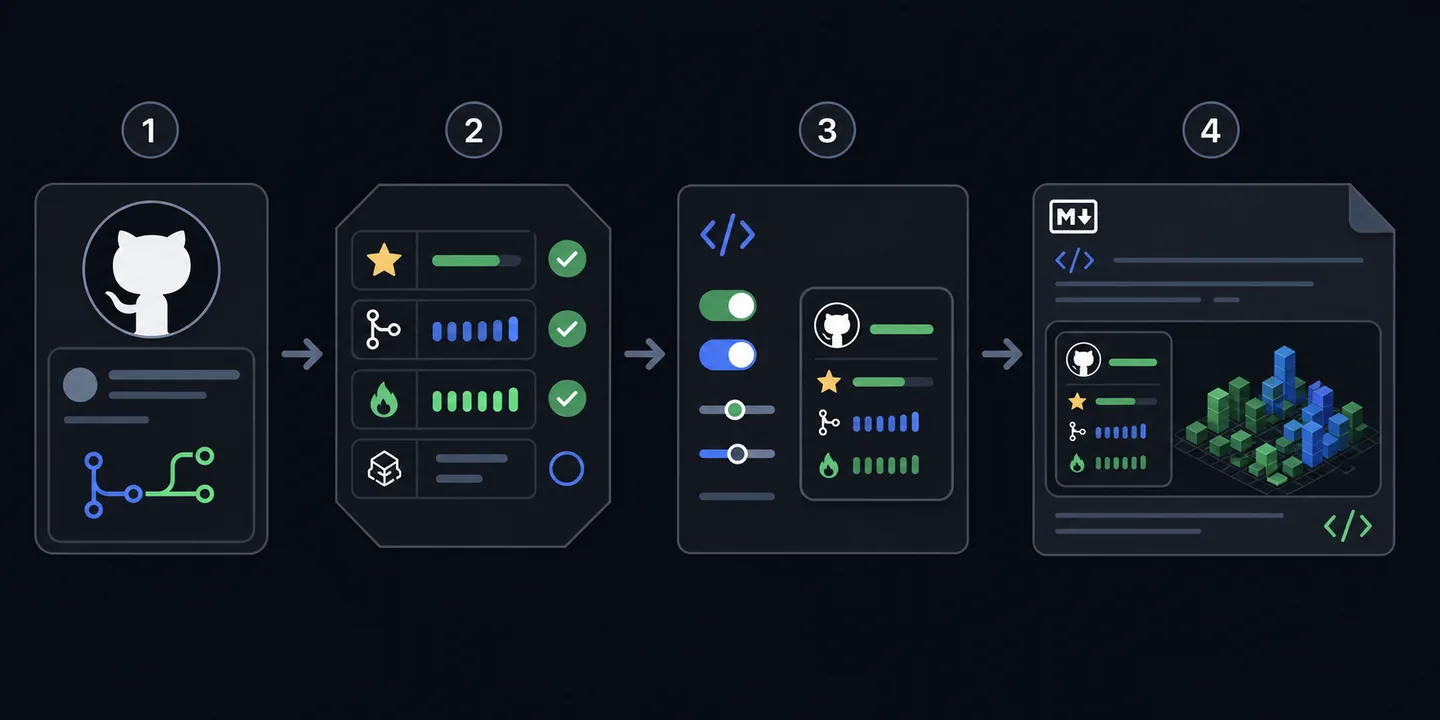
Start with the smallest useful card, verify it loads, and add options one at a time. This makes broken parameters and layout problems easier to isolate.
Create or open your profile README
Your public profile README lives in a repository whose name exactly matches your GitHub username. Add the card Markdown below your introduction or featured projects.
Use your exact username
Build the card URL with the official endpoint and replace the username parameter. Open the image URL directly before embedding it.
Choose a restrained theme
Match the card to the README background. Prefer readable contrast over novelty, and avoid stacking several visually loud widgets.
Add only meaningful options
Show icons, hide a metric that needs context, or include private-count behavior only after reading the project documentation and understanding its limits.
Which GitHub profile visual should you use?
Each widget answers a different question. Combining every widget usually weakens the profile; choose one primary visual and one supporting visual.
| Visual | Best for | Setup | Main limitation | Best placement |
|---|---|---|---|---|
| README stats card | Fast overview of repository activity | Image URL with username and options | Metrics need context | After bio or featured projects |
| Top languages card | Showing language mix | Separate compact card URL | Not a skill ranking | Beside or below main stats |
| Streak stats | Explaining recent consistency | Dedicated streak service | Can overemphasize daily activity | Only when consistency matters |
| GitHub City | Exploring the contribution calendar in 3D | Open the browser tool with a username | Not a replacement for project evidence | Link as an interactive deeper view |
Common GitHub README Stats problems
Most failures come from the username, URL encoding, service availability, repository visibility, or assumptions about what a metric includes.
The card does not load
Open the image URL directly, verify the username and parameters, remove options one by one, and check the official repository status or issues before rewriting the README.
Numbers look lower than expected
Confirm which repositories and contribution types are counted. Private activity, forks, ownership, caching, and API limits can change the result.
Theme is hard to read
Test the card on the actual README background. Use strong text contrast and avoid transparent combinations that disappear in light or dark mode.
Top languages feels misleading
Generated code, notebooks, vendored files, or one large repository can dominate the chart. Hide languages only when the choice is transparent and improves interpretation.
Build a profile around evidence, not widgets
A useful profile explains who you are, what you build, and where a reviewer should look next. Put featured projects, concise outcomes, and links to real code ahead of decorative statistics. One readable stats card can support that story; five cards usually compete with it.
Use internal links intentionally: the profile README template guide helps structure the whole page, while streak and trophy guides cover narrower widgets. GitHub City adds a memorable interactive view when contribution history is relevant, but the profile should still explain the work behind the blocks.
Review the README on desktop and mobile-width screens. Keep image dimensions stable, avoid overly wide rows, and remove widgets that repeat the same signal. A shorter profile with a clear reading order is usually more persuasive than a wall of cards.
Recommended combination
Use a short bio, two or three featured projects, one GitHub README Stats card, and one optional supporting visual. Keep the rest behind descriptive links so the README stays fast and readable.
GitHub README Stats FAQ
Is GitHub README Stats official GitHub functionality?
No. It is a popular open-source project that reads GitHub data and renders cards. GitHub hosts the profile README, but the card service is maintained separately.
How do I add GitHub stats to my README?
Create or edit the profile README repository, add Markdown containing the stats image URL with your username, preview the README, and keep only parameters that improve clarity.
Why are private commits missing?
Private activity depends on GitHub visibility settings, the card configuration, available API data, and the service implementation. Never assume a card can expose private repository details.
Should I use stats, streaks, or trophies?
Use stats for a broad snapshot, streaks for recent consistency, and trophies for milestone-style presentation. Choose the visual that supports the profile story instead of stacking all three.
Can I use GitHub City with README Stats?
Yes. Keep the stats card as a quick summary and link GitHub City as an interactive contribution-calendar view. The two formats serve different reading depths.