Fast Answer: A Git Activity Graph Is a View, Not the Source Data
A git activity graph is a visual summary of development activity over time. In everyday searches, people use the phrase for GitHub profile contribution charts, commit calendars, repository activity dashboards, README activity animations, and 3D visualizers such as GitHub City.
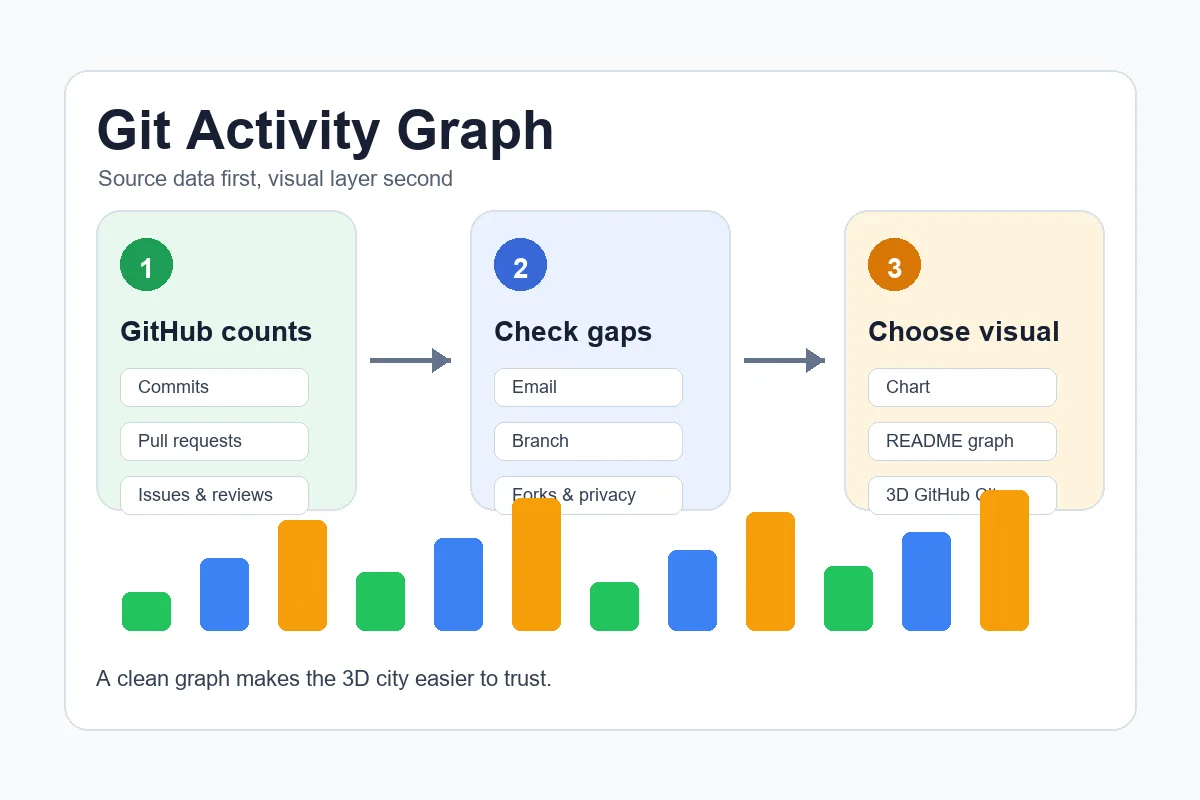
The important point is that the graph is only a view. It may summarize commits, pull requests, issues, reviews, or visible profile contributions, but it is not the same thing as your raw local Git history. A clean graph starts with counted GitHub data, then adds a presentation layer.
If your goal is troubleshooting, begin with the official GitHub profile graph and the repository commit history. If your goal is portfolio presentation, confirm the data first, then choose a contribution chart, README animation, or 3D city depending on the story you want to show.
Git Activity Graph Types and When to Use Each One
Search results for this topic mix several intents. Some users want to see their own GitHub activity, some want a chart for a README, and some want a more visual portfolio asset. The table keeps those jobs separate.
| Graph type | Best for | Limits | Next step |
|---|---|---|---|
| GitHub contribution chart | Checking visible profile activity across days, weeks, and years. | It follows GitHub counting rules and can hide private details. | Read the contribution graph guide. |
| GitHub commit graph | Diagnosing commit attribution, branch rules, forks, and missing commits. | It is not a complete measure of issues, reviews, planning, or private work. | Use the commit graph checklist. |
| README activity graph | Adding a lightweight activity visual to a profile or project README. | It may depend on third-party generation, cache freshness, and public data only. | Verify the official graph before embedding it. |
| GitHub City 3D view | Turning visible contribution patterns into a memorable city-like portfolio visual. | It inherits gaps from the source contribution data. | Open GitHub City after checking the data. |
How to Check Your GitHub Activity Graph Before Sharing It
Use this workflow when the graph looks empty, too small, too perfect, or inconsistent with the work you remember doing.
Open the official profile graph
Start from your GitHub profile, not a third-party widget. The official contribution chart tells you whether GitHub currently counts the activity at all.
Compare with repository commits
Open the repository history for the period that looks wrong. If commits exist in the repo but not on the profile, check author email, branch, fork behavior, and timing.
Check private contribution settings
Private activity can affect the visible graph only according to GitHub profile settings. Viewers may see anonymized contribution squares, not private repository names.
Choose the visual layer
Use a simple chart for accuracy checks, a README graph for profile decoration, and GitHub City when you want a 3D portfolio or presentation visual.
Add context when sharing
Explain what the graph represents. A dense chart can show public coding rhythm, but it does not measure design work, reviews outside GitHub, private work that stays hidden, or code quality.
Git Activity Graph vs GitHub Contribution Chart vs Commit Graph
These phrases overlap, but they should not target the same page. A contribution chart answers what GitHub counted on my profile. A commit graph answers why these commits counted or disappeared. A broader git activity graph answers which visual should I use for my goal.
This page exists for that broader decision. It links into the more specific guides when you need rules or troubleshooting, then points back to GitHub City when you are ready to visualize the result.
Use a contribution chart for source-of-truth checks
Best when you want to confirm whether GitHub counted activity before using any visualizer.
Use a commit graph for debugging
Best when specific commits are missing because of email, branch, fork, or repository context.
Use a README graph for lightweight display
Best when you want a compact profile visual and can accept public-data and cache limitations.
Use GitHub City for storytelling
Best when the official graph is already correct and you want a richer 3D view.
Common Reasons a Git Activity Graph Looks Wrong
The most common problem is not the chart itself. It is usually the underlying activity data: an unverified commit email, work that stayed on a non-counted branch, an unmerged fork, private activity that is hidden, or a recent update that has not appeared yet.
For portfolio use, avoid fixing the presentation before fixing the data. A beautiful visual can still mislead if it is based on incomplete contribution history.
Practical rule
If GitHub does not show the activity in the official profile graph, treat every downstream chart, README animation, and 3D city as incomplete until the source issue is resolved.
Where GitHub City Fits
GitHub City is the visual layer for users who want more than a flat heatmap. It turns visible GitHub contribution patterns into a city-like scene that is easier to explore, present, and remember.
Use it after your graph passes the basic checks. If the official GitHub contribution chart is accurate, GitHub City can help you turn that activity into a portfolio asset. If the source graph is missing work, read the contribution and commit graph guides first, then regenerate the city.
Git Activity Graph FAQ
What is a git activity graph?
It is a visual summary of Git or GitHub activity over time. Depending on context, it can refer to a GitHub contribution chart, commit graph, README activity widget, repository analytics chart, or 3D contribution visualizer.
Is a git activity graph the same as the GitHub contribution graph?
No. The GitHub contribution graph is one official profile-level chart. A git activity graph is a broader phrase that can include several chart and visualization types.
Why is my GitHub activity graph empty?
Common causes include unmatched commit email, commits on a branch GitHub does not count, unmerged forks, hidden private activity, or a delay before GitHub refreshes the profile graph.
Can I use a git activity graph in my portfolio?
Yes, but add context. It is useful for showing visible public activity patterns, not for proving code quality, private work, reviews, or every local commit.
When should I use GitHub City instead of a normal chart?
Use GitHub City when the official graph is already correct and you want a 3D visual for a profile, portfolio, presentation, or personal retrospective.